【WEB系列】 XML传参返回实战

220704-SpringBoot系列教程之XML传参返回实战

最近在准备使用微信公众号来做个人站点的登录,发现微信的回调协议居然是xml格式的,之前使用json传输的较多,结果发现换成xml之后,好像并没有想象中的那么顺利,比如回传的数据始终拿不到,返回的数据对方不认等

接下来我们来实际看一下,一个传参和返回都是xml的SpringBoot应用,究竟是怎样的

查看更多

分享到

【基础系列】基于maven多环境配置

SpringBoot系列之基于maven多环境配置

实际开发过程中,配置的多环境区分属于标配了,当我们不考虑配置中心时,将多环境的配置就放在项目的resource目录下,那么可以怎样做多环境的配置管理呢?

之前介绍过一篇基于 spring.profiles.active 配置来选择对应的配置文件的方式,有了解这个配置的小伙伴可以很快找到这种方式的特点

如配置值为dev,则加载 application-dev.yml 配置文件,如果为prod,则加载application-prod.yml

那么缺点就很明显了,当我每个环境的配置很多时,上面这种方式真的好用么?

接下来本文介绍另外一种常见的基于maven的多环境配置方式

查看更多

分享到

【WEB系列】内嵌Tomcat配置Accesslog日志文件生成位置源码探索

现在SpringBoot应用大多是内嵌tomcat,以jar包方式启动对外提供服务,最近遇到一个有意思的问题,当我希望输出tomcat的 access.log 时,添加上对应的配置之后,发现windowns系统下找不到这个日志文件,而linux/mac则没有什么问题;

所以花了些时间定位一下,本文将记录定位这个日志文件生成的全过程,当发现最后的结论时,更让我吃惊的事情来了,就这么个问题,在三年前我也遇到过,只不过当时的问题是上传文件之后,提示临时目录不存在,而这个临时目录和本文定位的目录居然是一回事,可谓是来了一次梦幻的联动,前面踩的坑不探究到底,后面迟早会继续掉坑😂

查看更多

分享到

【搜索系列】ES查询常用实例演示

本文将作为es系列第三篇,结合常见的实例,来演示下如何通过RestHighLevelClient来实现es的各种查询支持

查看更多

分享到

【搜索系列】ES文档基本操作CURD实例演示

本文将作为es系列第二篇,在前文项目搭建的基础上,先来看一下es的基本操作姿势,如何实现CURD

查看更多

分享到

【搜索系列】ES基本项目搭建

之前一直没有写ES相关的博文,现在开始补课,预计5-6篇博文将es的使用姿势展示给各位小伙伴;本文将作为es结合springboot的第一篇博文,基本项目环境搭建

查看更多

分享到

【WEB系列】从0到1实现自定义web参数映射器

SpringBoot系列之从0到1实现自定义web参数映射器

在使用SpringMVC进行开发时,接收请求参数属于基本功,当我们希望将传参与项目中的对象关联起来时,最常见的做法是默认的case(即传参name与我们定义的name保持一致),当存在不一致,需要手动指定时,通常是借助注解@RequestParam来实现,但是不知道各位小伙伴是否有发现,它的使用是有缺陷的

  • @RequestParam不支持配置在类的属性上

如果我们定义一个VO对象来接收传承,这个注解用不了,如当我们定义一个Java bean(pojo)来接收参数时,若是get请求,post表单请求时,这个时候要求传参name与pojo的属性名完全匹配,如果我们有别名的需求场景,怎么整?

最简单的如传参为: user_id=110&user_name=一灰灰

而接收参数的POJO为

1
2
3
4
public class ViewDo {
private String uesrId;
private String userName;
}

查看更多

分享到

【WEB系列】如何支持下划线驼峰互转的传参与返回

SpringBoot系列之Web如何支持下划线驼峰互转的传参与返回

接下来介绍一个非常现实的应用场景,有些时候后端接口对外定义的传参/返回都是下划线命名风格,但是Java本身是推荐驼峰命名方式的,那么必然就存在一个传参下换线,转换成驼峰的场景;以及在返回时,将驼峰命名的转换成下划线

那么如何支持上面这种应用场景呢?

本文介绍几种常见的手段

查看更多

分享到

【DB系列】Mybatis之批量插入的几种姿势

在日常的业务需求开发过程中,批量插入属于非常常见的case,在mybatis的写法中,一般有下面三种使用姿势

  • 单个插入,业务代码中for循环调用
  • <foreach>标签来拼接批量插入sql
  • 复用会话,拆分小批量插入方式

查看更多

分享到

【DB系列】Mybatis之ResultMap、ResultType返回结果使用姿势

在使用mybatis进行数据库操作时,如果希望将返回结果映射为项目中定义的实体对象Entity时,ResultMap与ResultType就很重要了;它们两的主要区别在于ResultType指定指定实体对象,ResultMap则定义数据库字段与实体的映射关系

接下来通过简单的实例来看一下这两种的使用姿势

查看更多

分享到

【中间件】Prometheus大盘配置实战

借助Grafana来实现大盘配置,关于Grafana的启用配置,这里就不详细说明,有兴趣的可以查看前文 * 【中间件】Prometheus实现应用监控 | 一灰灰Blog

接下来主要是针对上一篇 【中间件】Prometheus基于AOP实现埋点采集上报 上报的Histogram数据,来配置一套相对完整的业务监控大盘

查看更多

分享到

【中间件】Prometheus基于AOP实现埋点采集上报

前面几篇文章介绍了SpringBoot继承Prometheus实现埋点上报,基本上可以非常简单的实现采样收集,对于由SpringBoot搭建的web应用,甚至是可以说是引入依赖,简单的配置下,剩下的啥也不用管,就可以配置一个REST应用的监控大盘

接下来我们通过AOP的方式,来定义一个自定义数据采集的功能,用于实现一些上面覆盖不到的场景(如应用内的定时任务执行情况,三方接口请求监控等)

I. 方案确定与环境搭建

1.metric选择

通过前面的几篇文章,至少我们会了解到Prometheus的四种Metric,对于自定义的数据采集,根据最终希望监控的指标(每秒请求数 qps, 响应耗时 rt, 可用率 sla, 请求分布),我们这里选择Histogram

  • 通过histogram指标中的 count 值来计算qps
  • 通过 sum / count 来计算rt
  • 通过成功数 / 总请求数计算可用率sla
  • 通过histogram的bucket分布来查看请求分布

2.项目依赖

本项目借助SpringBoot 2.2.1.RELEASE + maven 3.5.3 + IDEA进行开发

其核心pom依赖,主要是下面几个包

1
2
3
4
5
6
7
8
9
10
11
12
13
14
15
16
17
18
19
20
21
22
23
24
25
26
<dependencies>
<dependency>
<groupId>org.springframework.boot</groupId>
<artifactId>spring-boot-starter-actuator</artifactId>
</dependency>

<dependency>
<groupId>org.springframework.boot</groupId>
<artifactId>spring-boot-starter-web</artifactId>
</dependency>

<dependency>
<groupId>io.micrometer</groupId>
<artifactId>micrometer-registry-prometheus</artifactId>
</dependency>
<dependency>
<groupId>org.springframework.boot</groupId>
<artifactId>spring-boot-starter-aop</artifactId>
</dependency>
<dependency>
<groupId>org.springframework</groupId>
<artifactId>spring-aop</artifactId>
<version>5.2.1.RELEASE</version>
<scope>compile</scope>
</dependency>
</dependencies>

3. 配置信息

其次是配置文件,注册下Prometheus的相关信息

1
2
3
4
5
6
7
8
9
10
11
spring:
application:
name: spring-prometheus-metric
management:
endpoints:
web:
exposure:
include: "*"
metrics:
tags:
application: ${spring.application.name}

上面配置中,有两个关键信息,前面博文也有介绍,这里简单说明

  • management.endpoints.web.exposure.include 这里指定所有的web接口都会上报
  • metrics.tags.application 这个应用所有上报的metrics 都会带上application这个标签

配置完毕之后,会提供一个 /actuator/prometheus的端点,供prometheus来拉取Metrics信息

II. AOP切面实现埋点上报

1. 切面实现类

通过切面来拦截目标类的执行,选择三个关键指标

  • service: 表示具体执行的类
  • method:执行的方法
  • err: true 表示执行异常/else 表示执行正常

直接使用Histogram来实现数据采集上报,直接使用前面博文* 【中间件】Prometheus自定义埋点姿势二 | 一灰灰Blog 使用姿势即可

1
2
3
4
5
6
7
8
9
10
11
12
13
14
15
16
17
18
19
20
21
22
23
24
25
26
27
28
29
30
31
32
33
34
35
36
37
38
39
40
@Aspect
@Component
public class MetricAop {
@Autowired
private MeterRegistry meterRegistry;

@Pointcut("execution(public * com.git.hui.demo.prometheus.service.*.*(..))")
public void point() {
}

/**
* 拦截Service共有方法,上报接口执行情况到Prometheus
*
* @param joinPoint
* @return
* @throws Throwable
*/
@Around("point()")
public Object execute(ProceedingJoinPoint joinPoint) throws Throwable {
String service = joinPoint.getTarget().getClass().getSimpleName();
String method = joinPoint.getSignature().getName();

Timer.Sample sample = Timer.start();
boolean hasError = false;
try {
return joinPoint.proceed();
} catch (Throwable e) {
hasError = true;
throw e;
} finally {
Timer timer = Timer.builder("micro_service_histogram")
.minimumExpectedValue(Duration.ofMillis(1))
.maximumExpectedValue(Duration.ofMinutes(3))
.sla(Duration.ofMillis(10), Duration.ofMillis(50), Duration.ofMillis(100), Duration.ofMillis(300), Duration.ofMillis(1000))
.tags(Tags.of("service", service, "method", method, "err", String.valueOf(hasError)))
.register(meterRegistry);
sample.stop(timer);
}
}
}

2. 测试方法

这里写两个简单的Service类,作为收集采样的目标

1
2
3
4
5
6
7
8
9
10
11
12
13
14
15
16
17
18
19
20
21
22
23
24
25
26
27
28
29
30
31
32
33
34
35
36
37
38
39
40
41
42
43
44
45
46
47
48
49
50
51
52
@Service
public class DemoService {
private Random random = new Random();

// 用于控制方法的执行耗时
private void trySleep() {
try {
Thread.sleep(random.nextInt(50));
} catch (InterruptedException e) {
e.printStackTrace();
}
}

public int add(int a, int b) {
trySleep();
return a + b;
}

public int sub(int a, int b) {
trySleep();
return a - b;
}

public int divide(int a, int b) {
trySleep();
return a / b;
}
}


@Service
public class HelloService {
private Random random = new Random();

private void trySleep() {
try {
Thread.sleep(random.nextInt(100) + 100);
} catch (InterruptedException e) {
e.printStackTrace();
}
}

public String hello(String name) {
trySleep();
return "hello: " + name;
}

public String welcome(String name) {
trySleep();
return "welcome: " + name;
}
}

然后我们通过定时任务来不断的访问上面的服务方法,用来模拟请求场景

1
2
3
4
5
6
7
8
9
10
11
12
13
14
15
16
17
18
19
20
21
22
23
24
25
26
27
28
29
30
31
32
33
34
35
36
@Autowired
private DemoService demoService;
@Autowired
private HelloService helloService;
private Random random = new Random();

private void call(Runnable runnable, CountDownLatch latch) {
new Thread(() -> {
try {
runnable.run();
} finally {
latch.countDown();
}
}).start();
}

// 100ms请求一次,基本上接口的qps在10左右
@Async("main")
@Scheduled(fixedDelay = 100)
public void doDemoCall() {
CountDownLatch latch = new CountDownLatch(3);
call(() -> demoService.add(random.nextInt(10), random.nextInt(30)), latch);
call(() -> demoService.sub(random.nextInt(10), random.nextInt(30)), latch);
// 注意这个divide,分母是可能存在为0的哦
call(() -> demoService.divide(random.nextInt(10), random.nextInt(30)), latch);
latch.countDown();
}

@Async
@Scheduled(fixedDelay = 100)
public void doHelloCall() {
CountDownLatch latch = new CountDownLatch(2);
call(() -> helloService.hello("YiHui " + random.nextInt(30)), latch);
call(() -> helloService.welcome("YiHui " + random.nextInt(30)), latch);
latch.countDown();
}

3. 启动类

最后就是在启动类中注册一下MeterRegistryCustomizer,为所有的metric携带上application标签

1
2
3
4
5
6
7
8
9
10
11
12
13
14
15
16
@EnableScheduling
@SpringBootApplication
public class Application {

public static void main(String[] args) {
SpringApplication.run(Application.class);
}

@Bean
MeterRegistryCustomizer<MeterRegistry> configurer(@Value("${spring.application.name}") String applicationName) {
return (registry) -> {
registry.config().commonTags("application", applicationName);
MetricWrapper.setMeterRegistry(registry);
};
}
}

应用启动之后,就可以通过http://m-162d9nnes031u:8080/actuator/prometheus来查看收集的采样信息了,如

4. 业务大盘配置

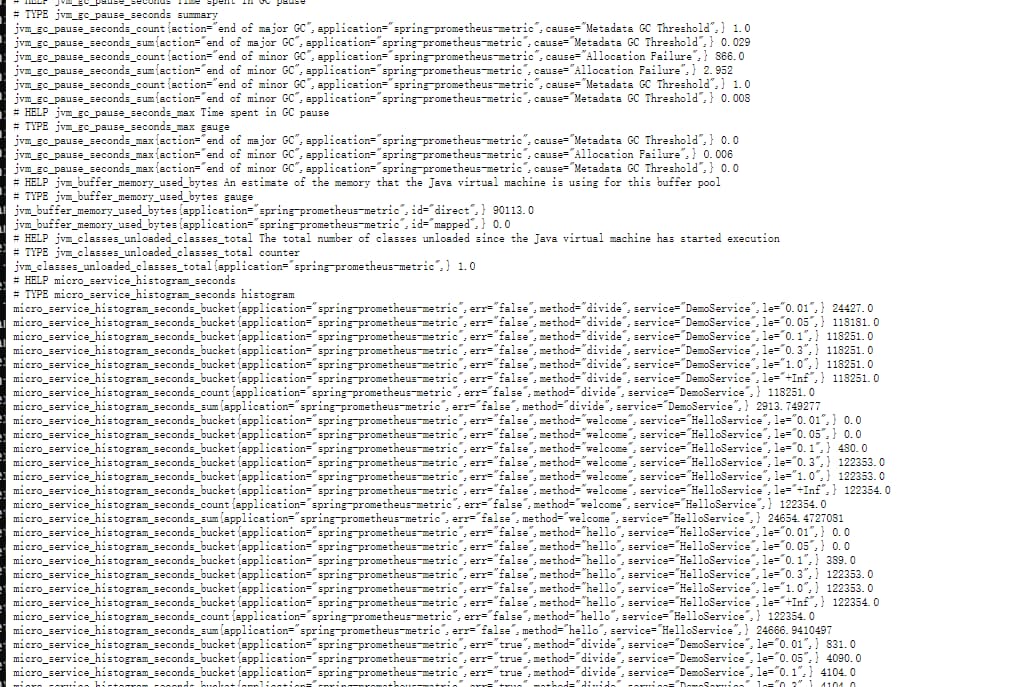
上面基本即实现了一个基于aop的采样收集,接下来重点就是如何将这些收集上来的数据,可视化配置起来

借助Grafana无疑是个比较推荐的case,下一篇博文将详细介绍如何针对上面收集的信息进行友好的配置,欢迎有兴趣的小伙伴关注吐槽

III. 不能错过的源码和相关知识点

0. 项目源码

系列博文:

1. 微信公众号: 一灰灰Blog

尽信书则不如,以上内容,纯属一家之言,因个人能力有限,难免有疏漏和错误之处,如发现bug或者有更好的建议,欢迎批评指正,不吝感激

下面一灰灰的个人博客,记录所有学习和工作中的博文,欢迎大家前去逛逛

一灰灰blog


打赏 如果觉得我的文章对您有帮助,请随意打赏。
分享到